
This Unique Take On Bitcoin Suggests A Bear Phase Is Near
This Unique Take On Bitcoin Suggests A Bear Phase Is Near
By Tony Spilotro – February 23, 2021 in BTC Reading Time: 3min read

Bitcoin just experienced one of its steepest corrections in months, and one of only a handful of pullbacks since the uptrend began. However, one unique perspective on the cryptocurrency’s long-term price chart suggests that another bear market could be incoming as volatility in the asset dwindles over time.
The idea is based on the leading cryptocurrency by market cap nearly reaching to top of a logarithmic growth channel one highly accurate analyst has charted. Here’s a look at this unique take on the Bitcoin price action ahead.
Bitcoin Bulls Finally Run Into A Wall After Whale Sparks Selloff
After touching nearly $60,000 over the weekend, Bitcoin price has fallen as deep as $45,000 per coin in just days since the week started.
The drop was prompted by a whale moving 28,000 BTC worth $1.6 billion at the time, to crypto exchange Gemini.
The selloff is among the deepest corrections the cryptocurrency has seen since last March, when the price shed over 70% in a matter of days. But could it be the top of the current rally?
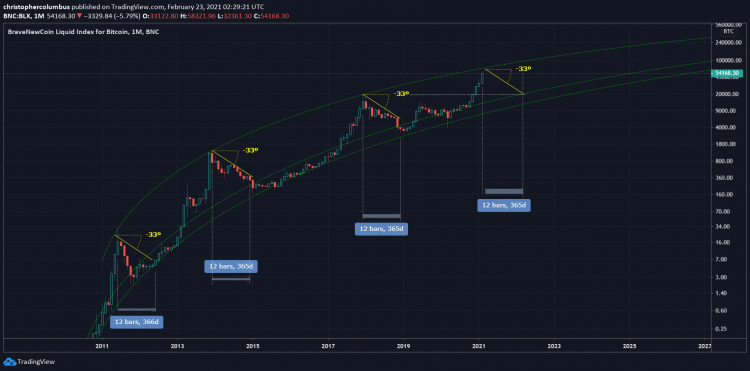
According to the logarithmic growth curve drawn by long-term chartist Dave the Wave, the peak of this cycle could be near, and another bear market could be almost as close.
Beware of Bear, Says Highly Accurate Crypto Analyst
Using the same model, Dave the Wave called the bottom of the bear market, so why couldn’t the same model predict the peak? If the current uptrend’s peak reaches the top trendline of the logarithmic growth curve, the distance from the near-term peak would be very close.
Each time Bitcoin price has touched the top trendline in the past, a bear phase will technically already have begun.
Either way, after rising so sharply, the log growth curve seems to indicate that some correction is due one way or another. As Dave the Wave also elaborates, each cycle’s drawdown was set at a 33-degree slope. If the same angle trend happens with the current correction, the bottom would be hit when Bitcoin touches down at $20,000 again eventually.
What’ll it be? A retest of $20,000 to complete the next “bear market” before moving higher, or will this model be proven ineffective for the first time in the asset’s history?
Featured image from Deposit Photos, Charts from TradingView.com

Advertisement
The original article was written by Tony Spilotro and posted on NewsBTC.com.
Article reposted on Markethive by Jeffrey Sloe