The Creator of Bollinger Bands Hints at Bitcoin BTC Breaking 10K

The Creator of Bollinger Bands Hints at Bitcoin (BTC) Breaking $10K
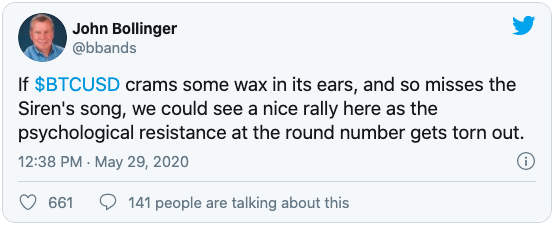
In a recent tweet, John Bollinger has hinted that Bitcoin can break the psychological price of $10,000.

John P. Njui • BITCOIN (BTC) NEWS – CRYPTOCURRENCY • May 29, 2020
In brief:
- The creator of Bolling Bands has postulated a scenario where Bitcoin rallies and breaks $10,000.
- CME Bitcoin futures expired earlier today.
- Bitcoin is holding steady above the $9,400 and $9,300 support levels.
The creator of the industry-tested charting tool of Bollinger Bands, John Bollinger, has hinted at the possibility of Bitcoin experiencing a nice rally that could see BTC push hard above the psychological price of $10,000. Mr. Bollinger expressed his trading idea via the following Tweet.
May’s CME Bitcoin Futures Have Expired
Also to note, is that the CME Bitcoin futures for the month of May expired a few hours ago. According to the CME Group website, the derivatives expire on the last Friday of every month at 4 pm London time.
Trading terminates at 4:00 p.m. London time on the last Friday of the contract month. If this is not both a London and U.S. business day, trading terminates on the prior London and the U.S. business day.
What Next for Bitcoin in the Crypto Markets?

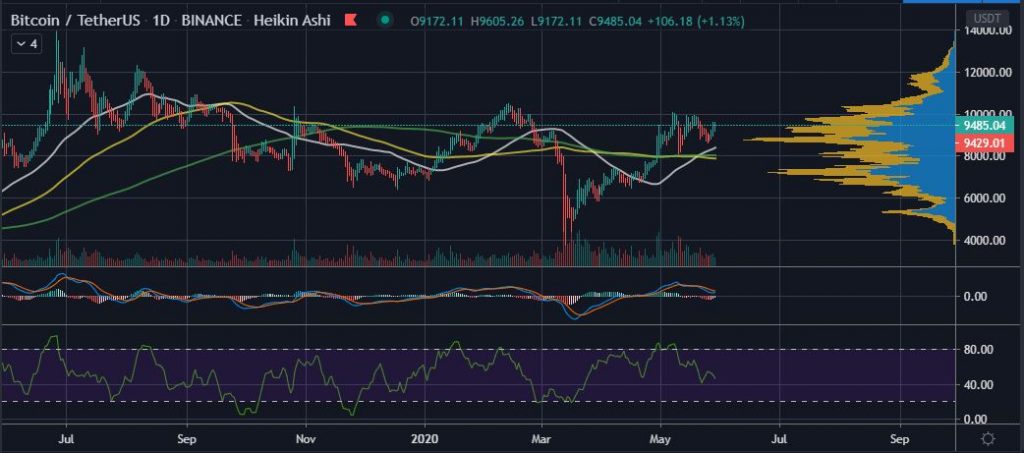
1-Day BTC/USDT chart (Click on image for larger view)
Further taking a look at the daily BTC/USDT chart courtesy of Tradingview.com, we observe the following.
- The Golden Cross on the daily chart is very much valid and could lead to BTC testing $10,000 once again.
- The current price of Bitcoin at $9,400 is above the 50-day, 100-day, and 200-day moving averages further pleading the case of a bullish scenario in the following days.
- The short term support zones for Bitcoin are $9,300, $9,200, $9,050, $8,800 and $8,600.
- Conversely, the short term resistance zones for Bitcoin are around $9,500, $9,600, $9,680, $9,773, $9,879, $9,940 and $10,000.
Possible Retracement for Bitcoin Before a Push-Up
However, there is the possibility of a retracement for Bitcoin as seen through the following chart on the 6-hour timeframe.

6-Hour BTC/USDT Chart (Click on image for larger view)
From this chart, we observe that the bullish momentum of Bitcoin in recent days might be followed by a retracement. The trade volume is seen to be reducing with the MACD moving averages further indicating a move down into the weekend. Additionally, the MFI is high at 75 further pointing to a scenario where Bitcoin will undergo a cool down before the move Mr. Bollinger has suggested, plays out.
As with all technical analyses of Bitcoin, traders and investors are advised to practice risk management as well as use stop losses to protect trading capital.
(Feature image courtesy of Unsplash.com)
Original article posted on the EthereumWorldNews.com site, by John P. Njui.
Article re-posted on Markethive by Jeffrey Sloe
Visit MarketHive to learn more: http://markethive.com/jeffreysloe


